Commute Patterns Map
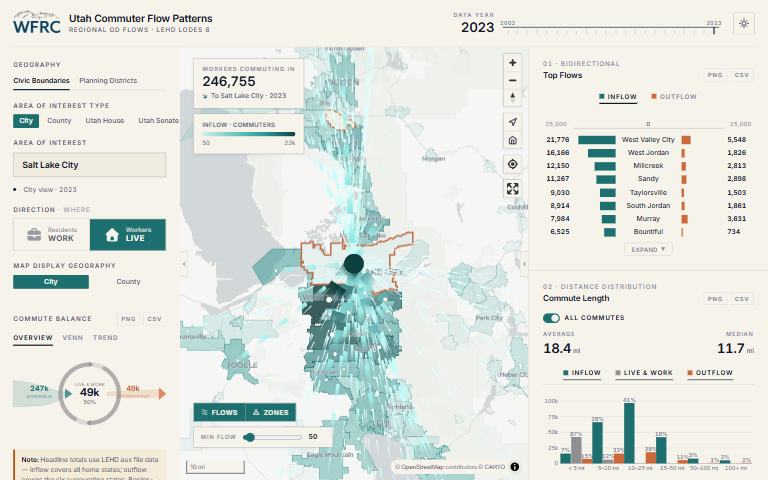
Where do residents of a city, county or legislative district work, and where do its workers live?
What it answers
Where do residents of a city, county or legislative district work, and where do its workers live?
For: Policy questions tied to named places and political districts.
What is inside
- An arc flow map for any city, county, Utah House district or Utah Senate district, in either direction.
- Charts for commute balance, a flow diagram, means of transportation, travel time to work, commute distance and industry mix.
- Every chart exports as an image or a table.
- Data from 2002 to 2023, and light and dark display modes.
Where the data comes from
- US Census LEHD LODES 8 for flows, industries and distances.
- American Community Survey 5-year estimates for means of transportation and travel time.
About this tool
| Type | App |
| Status | Live |
| Last updated | September 22, 2026 (latest change to the source code) |
| Terms | WFRC’s material is licensed CC BY 4.0; data from other sources keeps its own terms. See the terms of use. |
How to cite
Wasatch Front Regional Council. (2026). Commute Patterns Map [Online tool]. https://wfrc.utah.gov/maps/regional-commuter-flows/
Questions or problems?
Email analytics@wfrc.utah.gov or open an issue on the source repository. See also all apps and maps.