TDM Calibration Dashboard
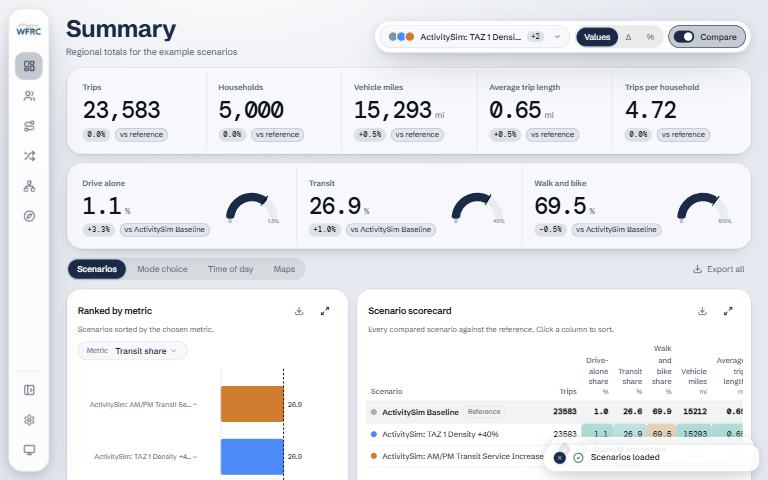
How well does a model run match observed data such as traffic counts and the household travel survey?
What it answers
How well does a model run match observed data such as traffic counts and the household travel survey?
For: Analysts calibrating and validating the activity-based travel demand model (ActivitySim).
What is inside
- Panels for Summary, Person and Household, Tour, Mode Choice, Trip, Network and a free-form Explore sandbox.
- Network panels compare screenline volumes with observed counts and show VMT by facility type and desire lines.
- Several scenarios can be loaded at once for side-by-side or overlaid comparison, with shareable deep links.
- Everything is computed in the browser; the data never leaves the user’s machine.
Where the data comes from
- Pre-computed summary files from ActivitySim model runs.
- Observed validation data, including AADT counts and the household travel survey, always available to every panel.
About this tool
| Type | App |
| Status | Live |
| Last updated | October 23, 2026 (latest change to the source code) |
| Terms | WFRC’s material is licensed CC BY 4.0; data from other sources keeps its own terms. See the terms of use. |
How to cite
Wasatch Front Regional Council. (2026). TDM Calibration Dashboard [Online tool]. https://wfrcanalytics.github.io/APP-wftdm-dashboard/
Questions or problems?
Email analytics@wfrc.utah.gov or open an issue on the source repository. See also all apps and maps.