vizTool
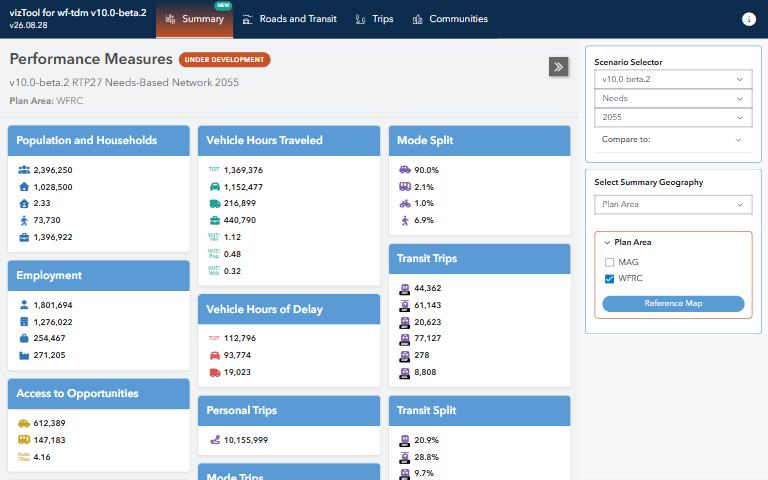
What do the travel demand model’s results look like across roads, transit, mode share and accessibility?
What it answers
What do the travel demand model’s results look like across roads, transit, mode share and accessibility?
For: Planners and analysts exploring model results and the input data behind them.
What is inside
- Maps and charts of roadway, transit ridership, mode split and socioeconomic measures.
- Access to jobs and households, with comparisons across geographies and travel modes.
- A wiki with usage notes on the project’s GitHub page.
Where the data comes from
- Results and inputs of the Wasatch Front Travel Demand Model.
About this tool
| Type | App |
| Status | Live |
| Last updated | August 27, 2026 (latest change to the source code) |
| Terms | WFRC’s material is licensed CC BY 4.0; data from other sources keeps its own terms. See the terms of use. |
How to cite
Wasatch Front Regional Council. (2026). vizTool [Online tool]. https://wfrc.utah.gov/viztool-latest-build/
Questions or problems?
Email analytics@wfrc.utah.gov or open an issue on the source repository. See also all apps and maps.